
Anonymous weaving deployment • Pakistan
Live visibility across a mixed loom shed
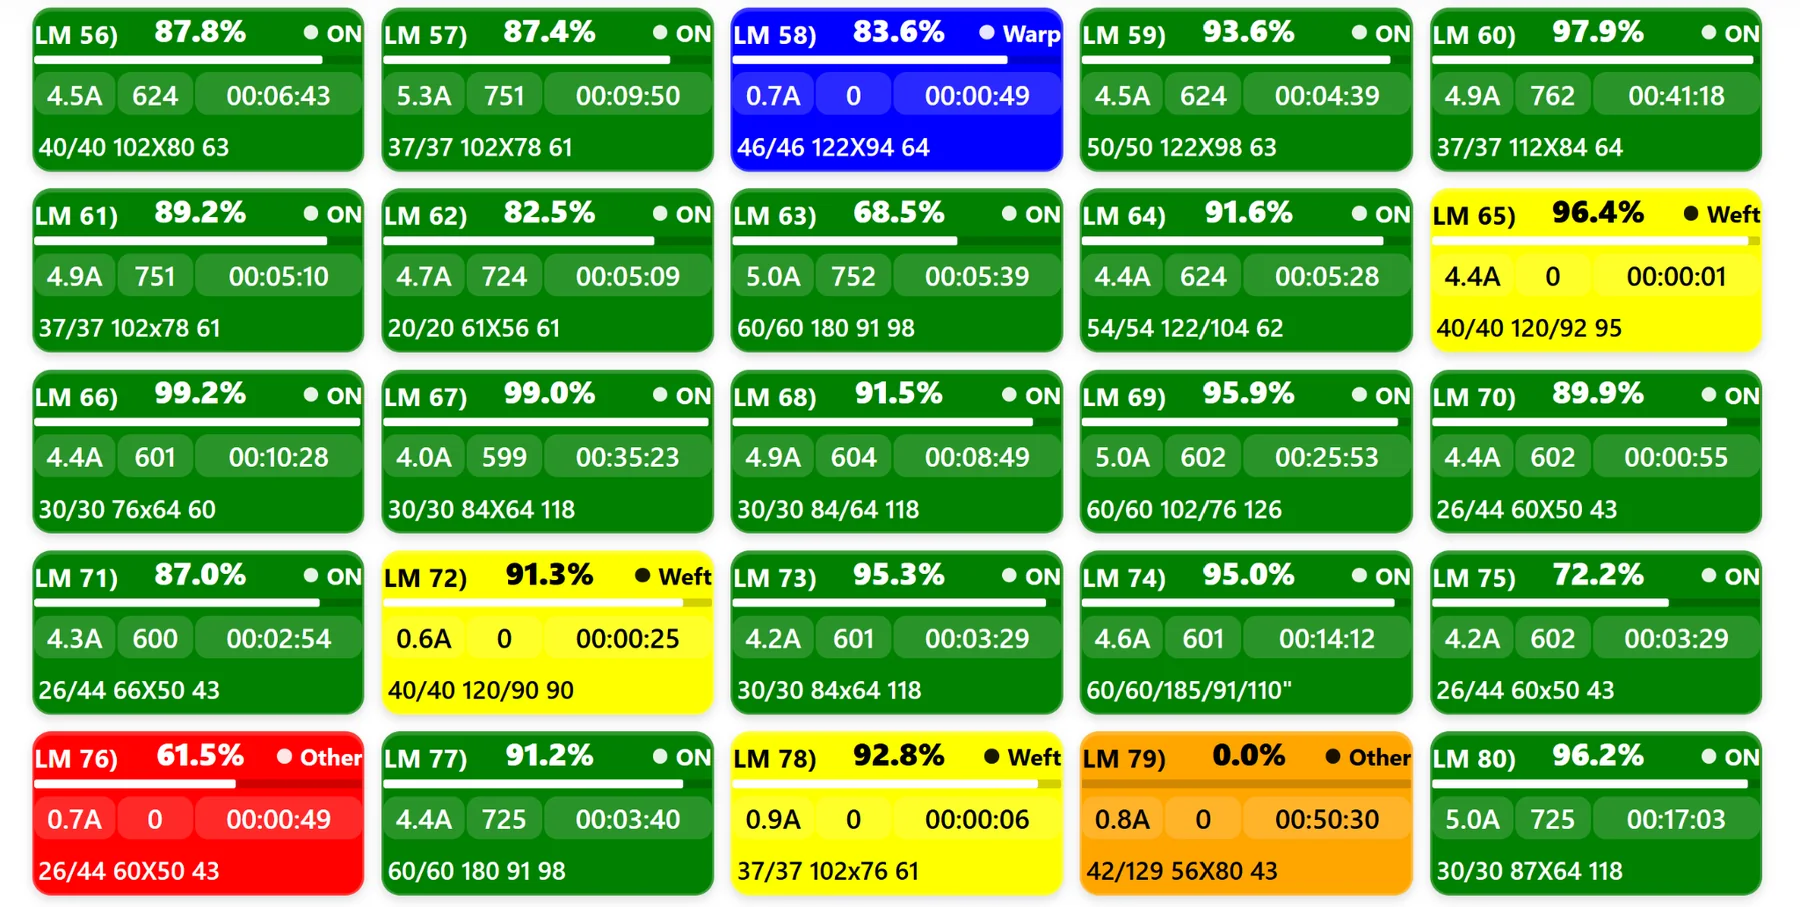
Machine cards combine operating state, efficiency, current, RPM and status duration so supervisors can immediately see which looms need attention.
Customer identities are not shown here. These examples describe the types of operational questions addressed by our monitoring work without publishing confidential customer information.
Machine cards combine operating state, efficiency, current, RPM and status duration so supervisors can immediately see which looms need attention.

Efficiency ranking helps technical teams focus on repeated low performers instead of searching machine by machine through a large shed.
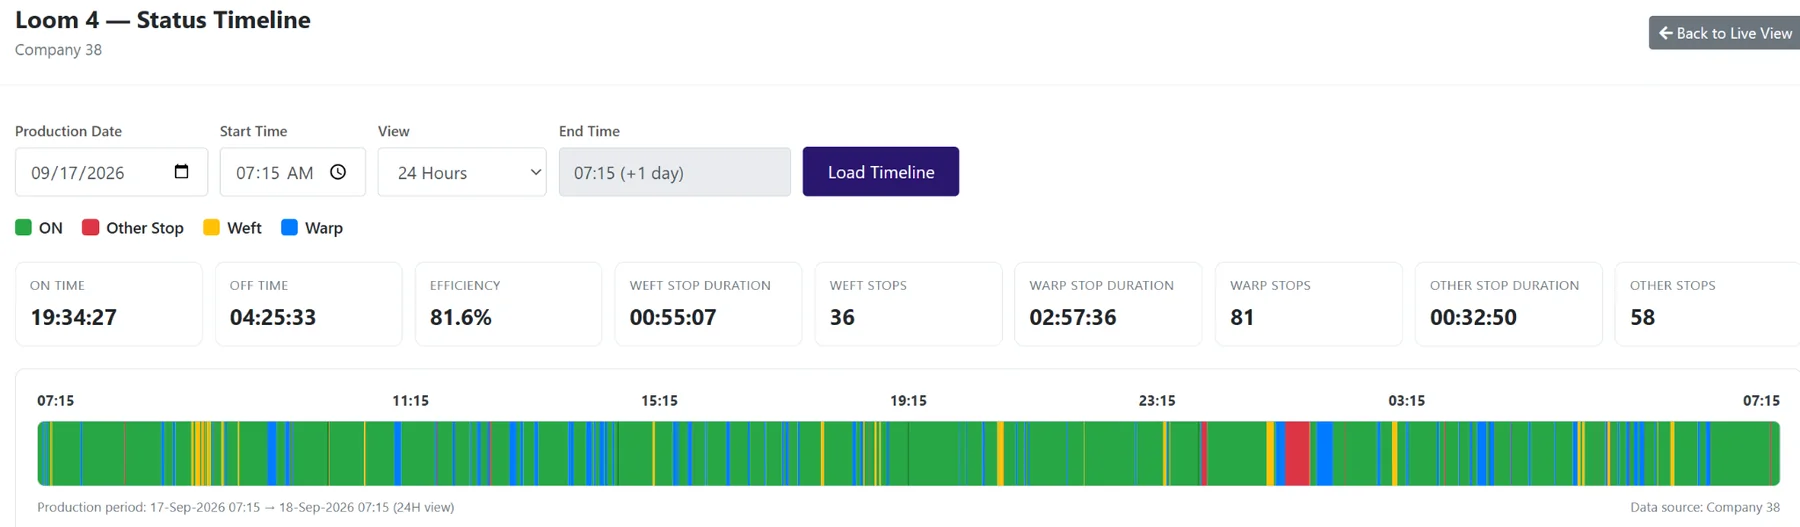
A 24-hour machine timeline provides a factual record of when production was running and how different stop reasons accumulated.
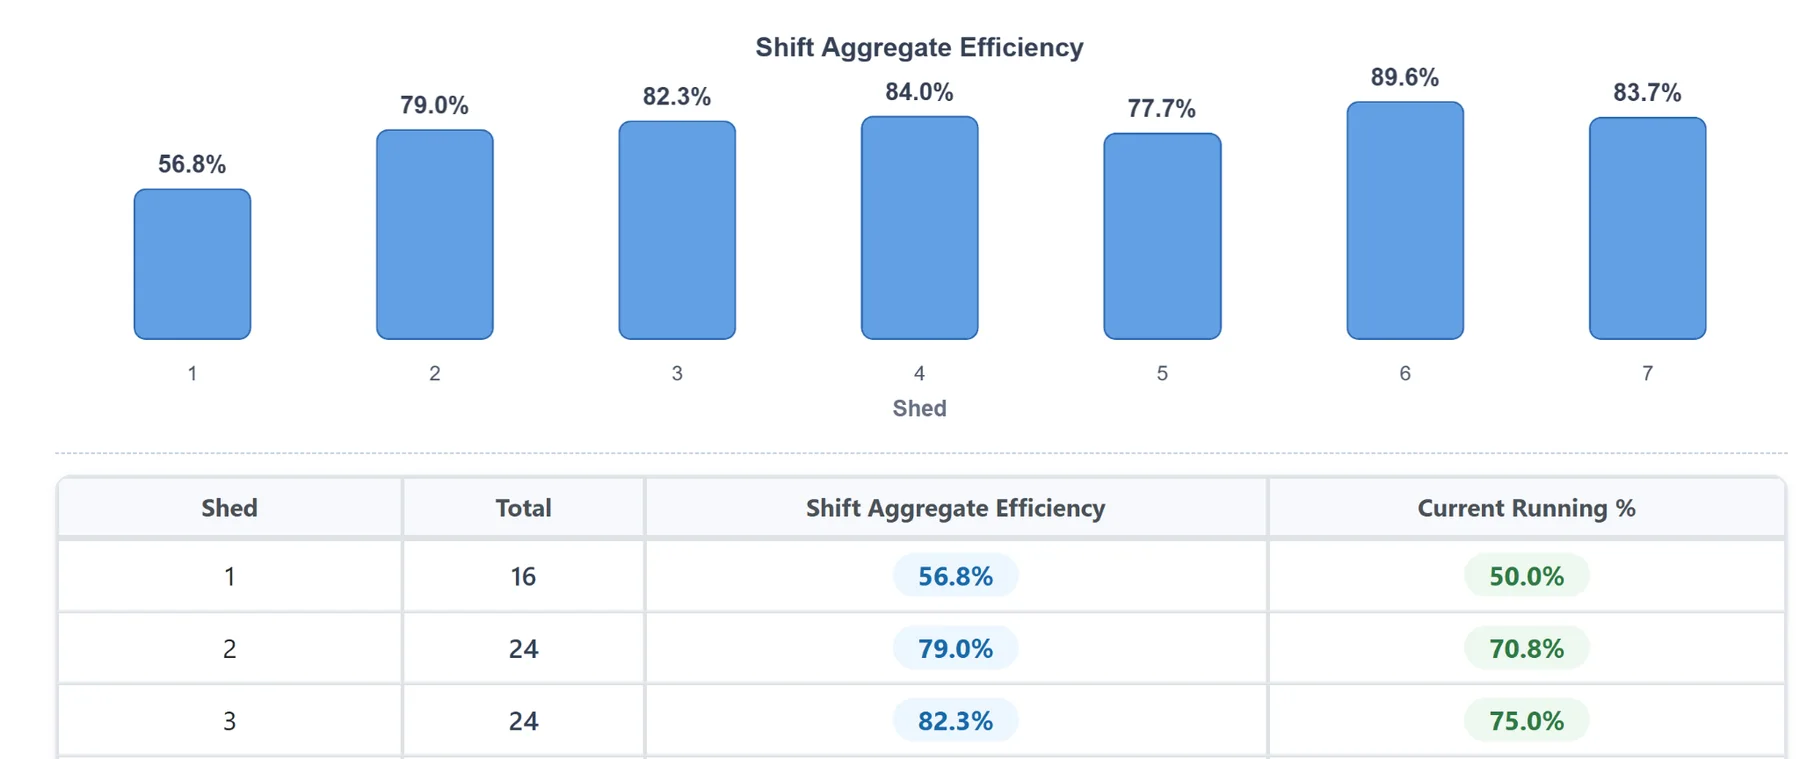
Aggregate efficiency and current running percentage make it easier to see which shed or machine group is pulling down overall performance.
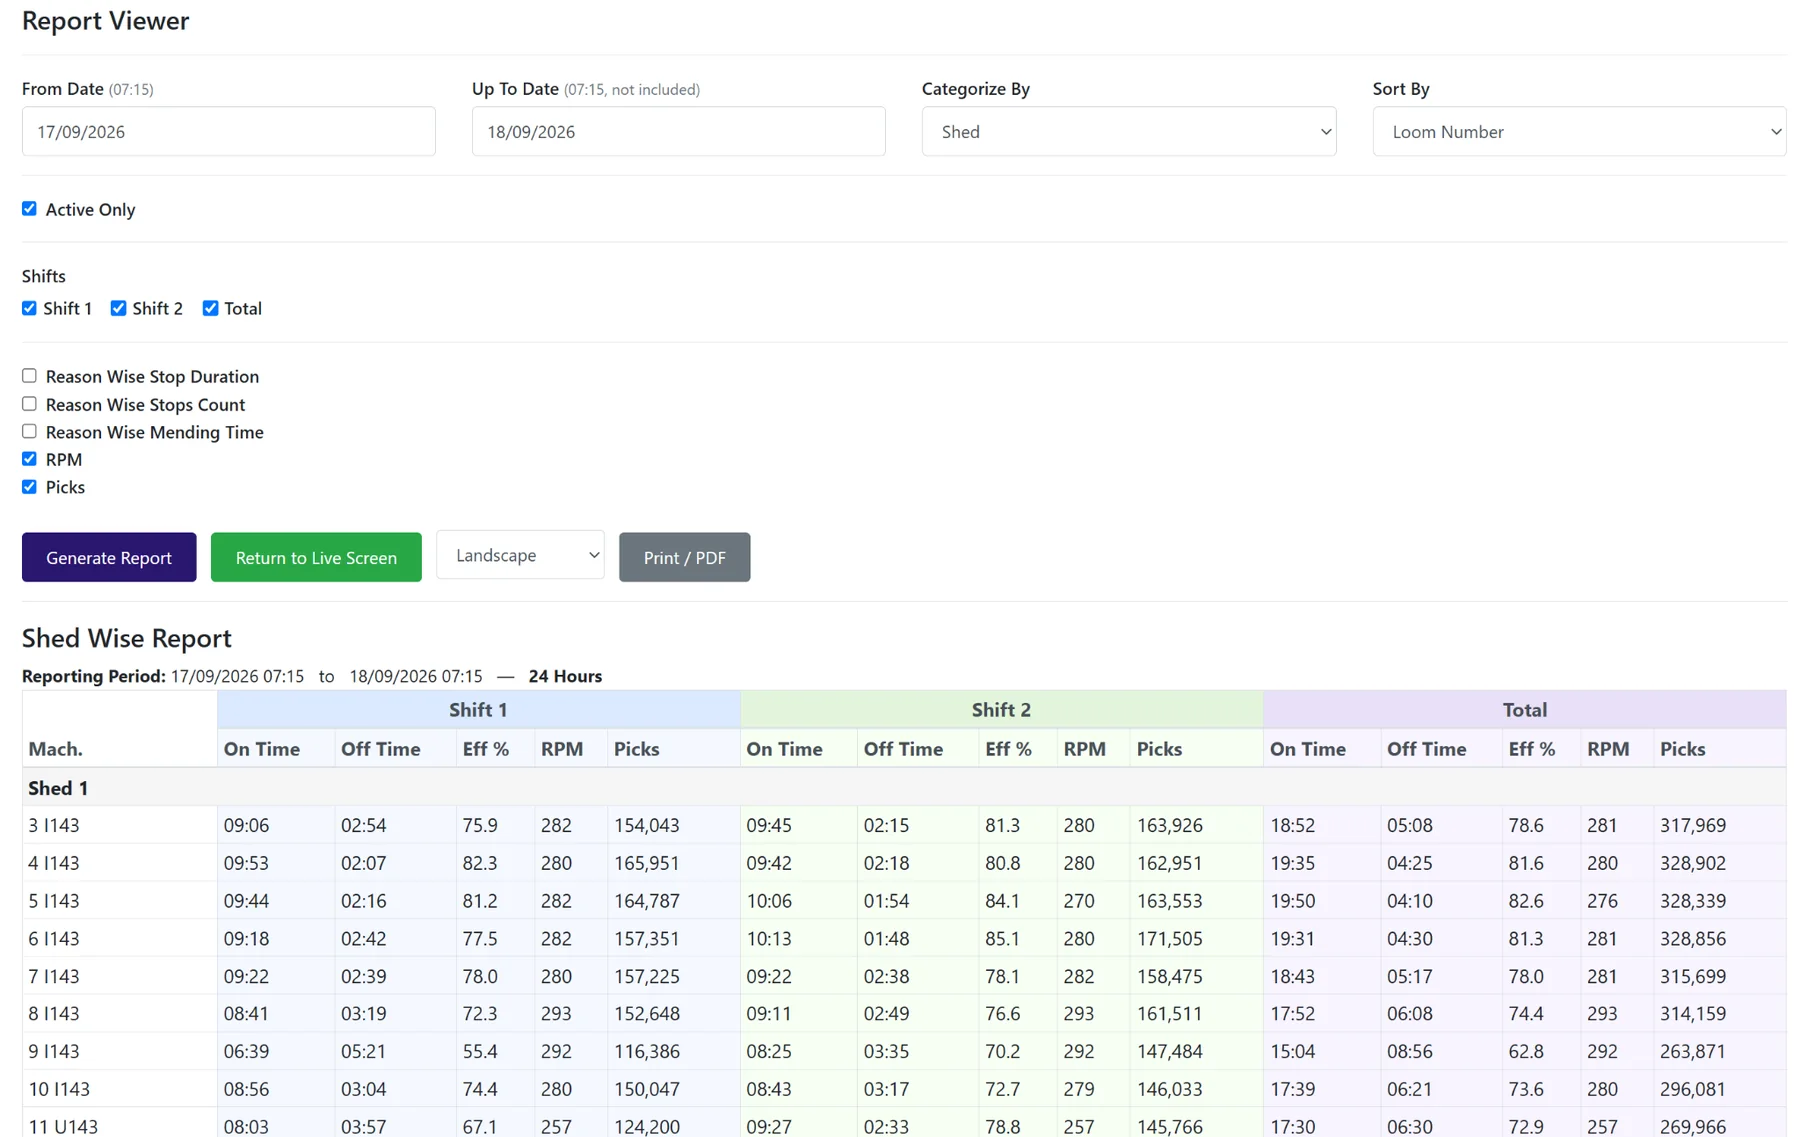
On time, off time, efficiency, RPM and picks can be reviewed by machine, shift and shed for structured production follow-up.
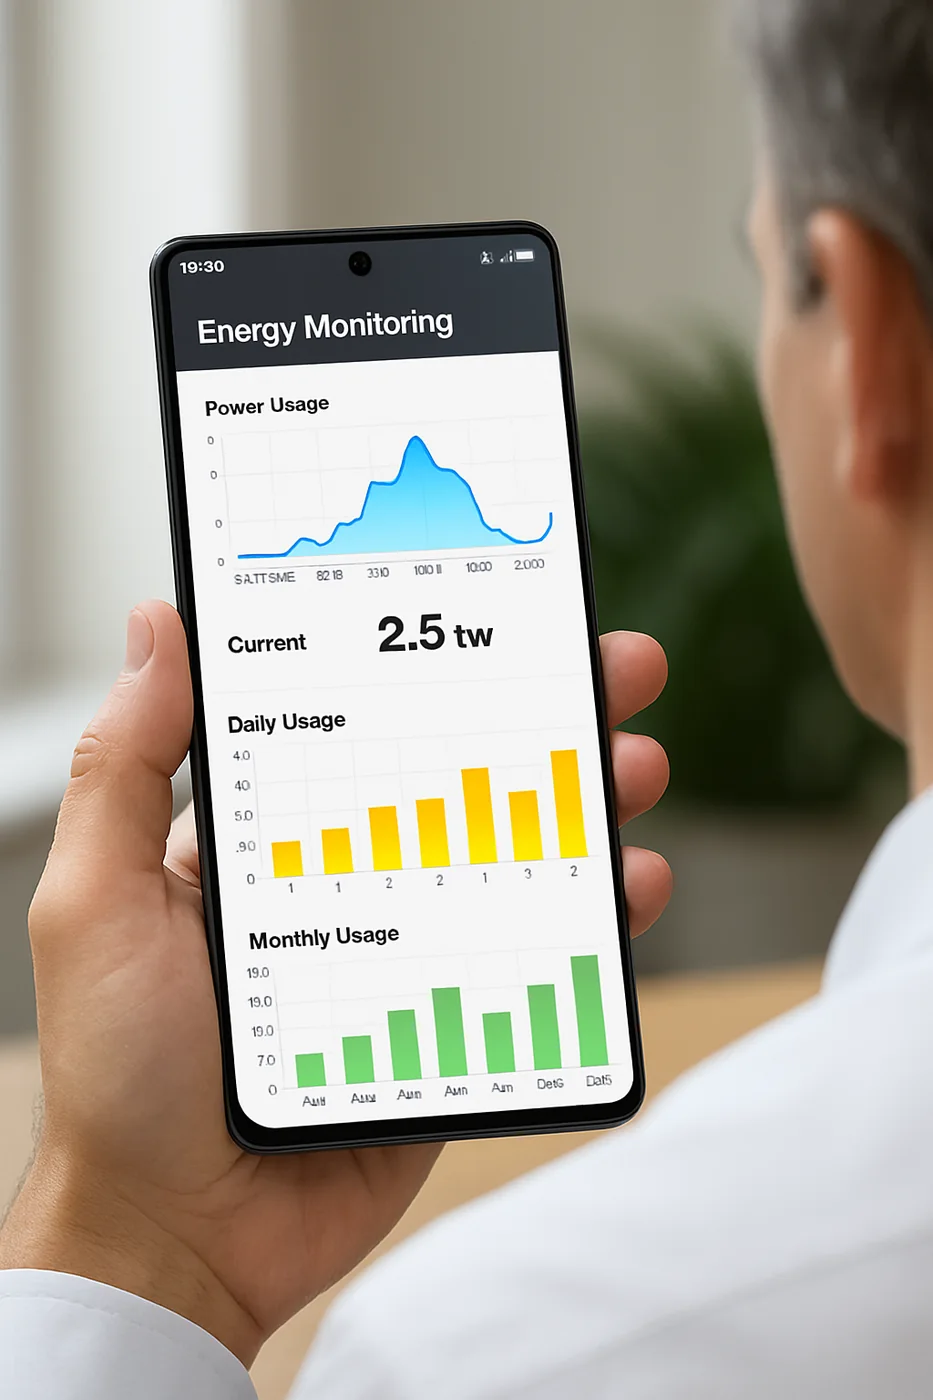
Smart energy meters and energy analysers can feed a central dashboard so teams can compare consumption across selected machines, panels or processes.
Tell us what you want to measure and how your team currently reviews it.