
Point-wise real-time power and energy monitoring.
Connect smart energy meters and energy analysers to a central monitoring platform so your team can see where electrical power is being used — machine by machine, panel by panel or process by process.
Use the meters already designed to measure electrical parameters.
We can integrate compatible smart energy meters and multifunction energy analysers, collect their digital data and present it in a common dashboard. This keeps measurement at the field-device level while the monitoring system handles collection, history and visualization.
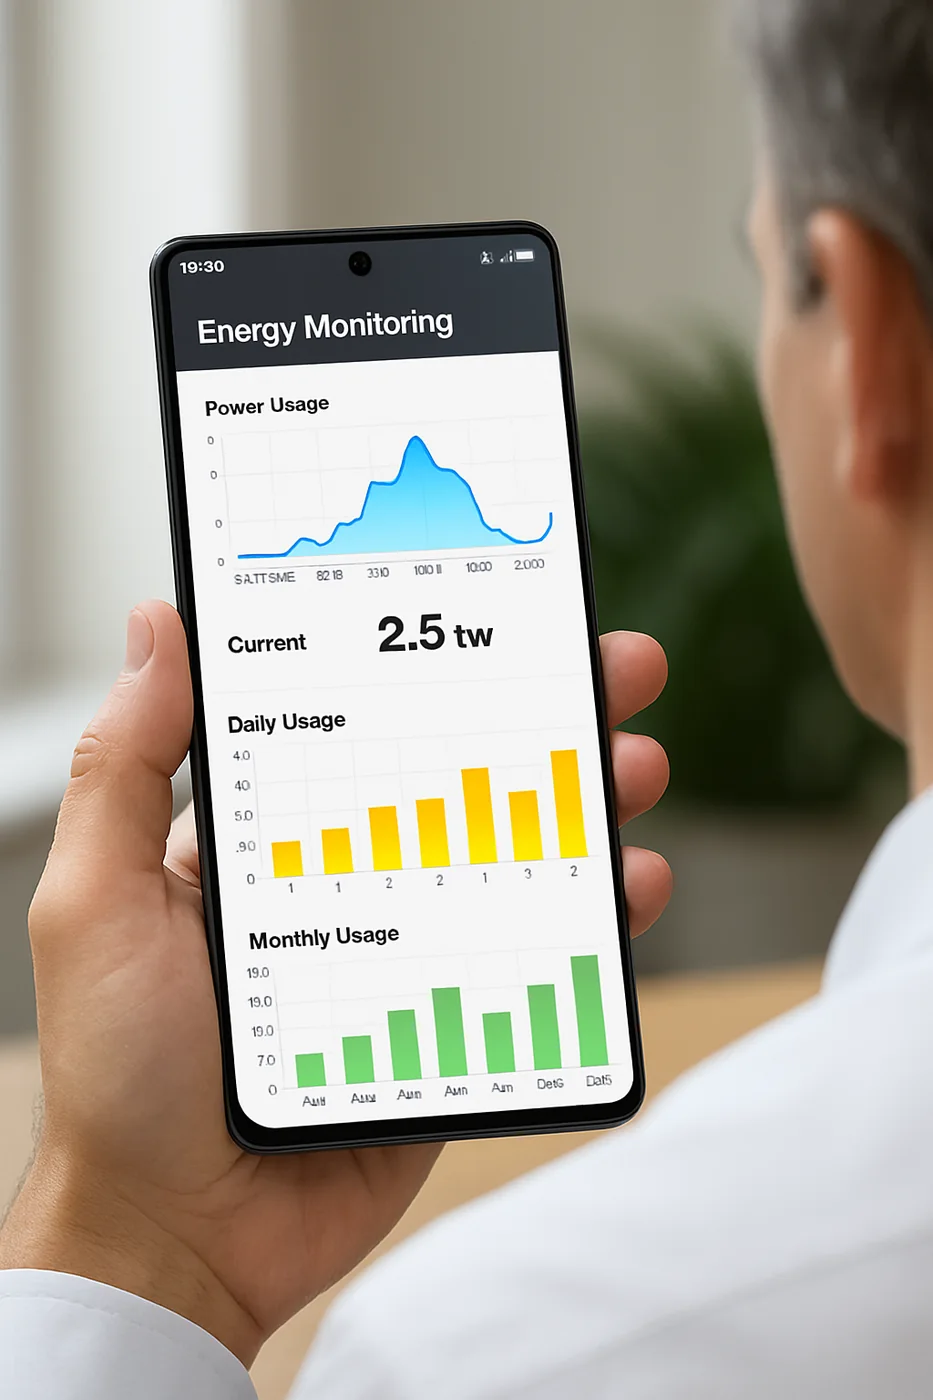
See consumption where it happens, not only at the incoming feeder.
Plant-wide billing data tells you the total. Point-wise monitoring helps identify which loads, machines or areas are responsible for that consumption and how the pattern changes through the day.
High-demand equipment
Compare present power demand across monitored points and investigate loads that stand out from similar equipment.
Idle or non-productive consumption
Identify energy use that continues while a machine or process is not productively operating.
Production vs energy
Where production data is also available, compare output with electrical consumption to support energy-efficiency analysis.
Abnormal operating patterns
Historical trends can make unusual consumption, current or power behavior easier to recognize and investigate.
Dedicated web viewing for authorized users.
A dedicated cloud service can be included so energy dashboards and historical data are available through a standard web browser. This is useful for management teams that need visibility outside the control room or plant network.
Explore cloud monitoringWant point-wise energy visibility?
Share the number of monitoring points, meter/analyser models and the electrical parameters you want to see. We can design the data collection and dashboard around your plant.